I started this blog a while ago (before Claude was a thing). So far, I haven’t made any posts about my side projects because I’ve preferred to spend my free time actually building things. The upside of this approach is that I’ll have a lot to share once I start publishing more meaningful posts.
Progress in the Vantage codebase has been great recently. Right now, I have an application that can render 3D objects using a simple, effect-based system for creating and managing scenes. Users can create primitives such as nodes, lines, and planes. Scripting with lua is also possible with a simple text editor included out of the box.
Just for everyone to get an idea of what the thing i am building looks like I made a screenshot:
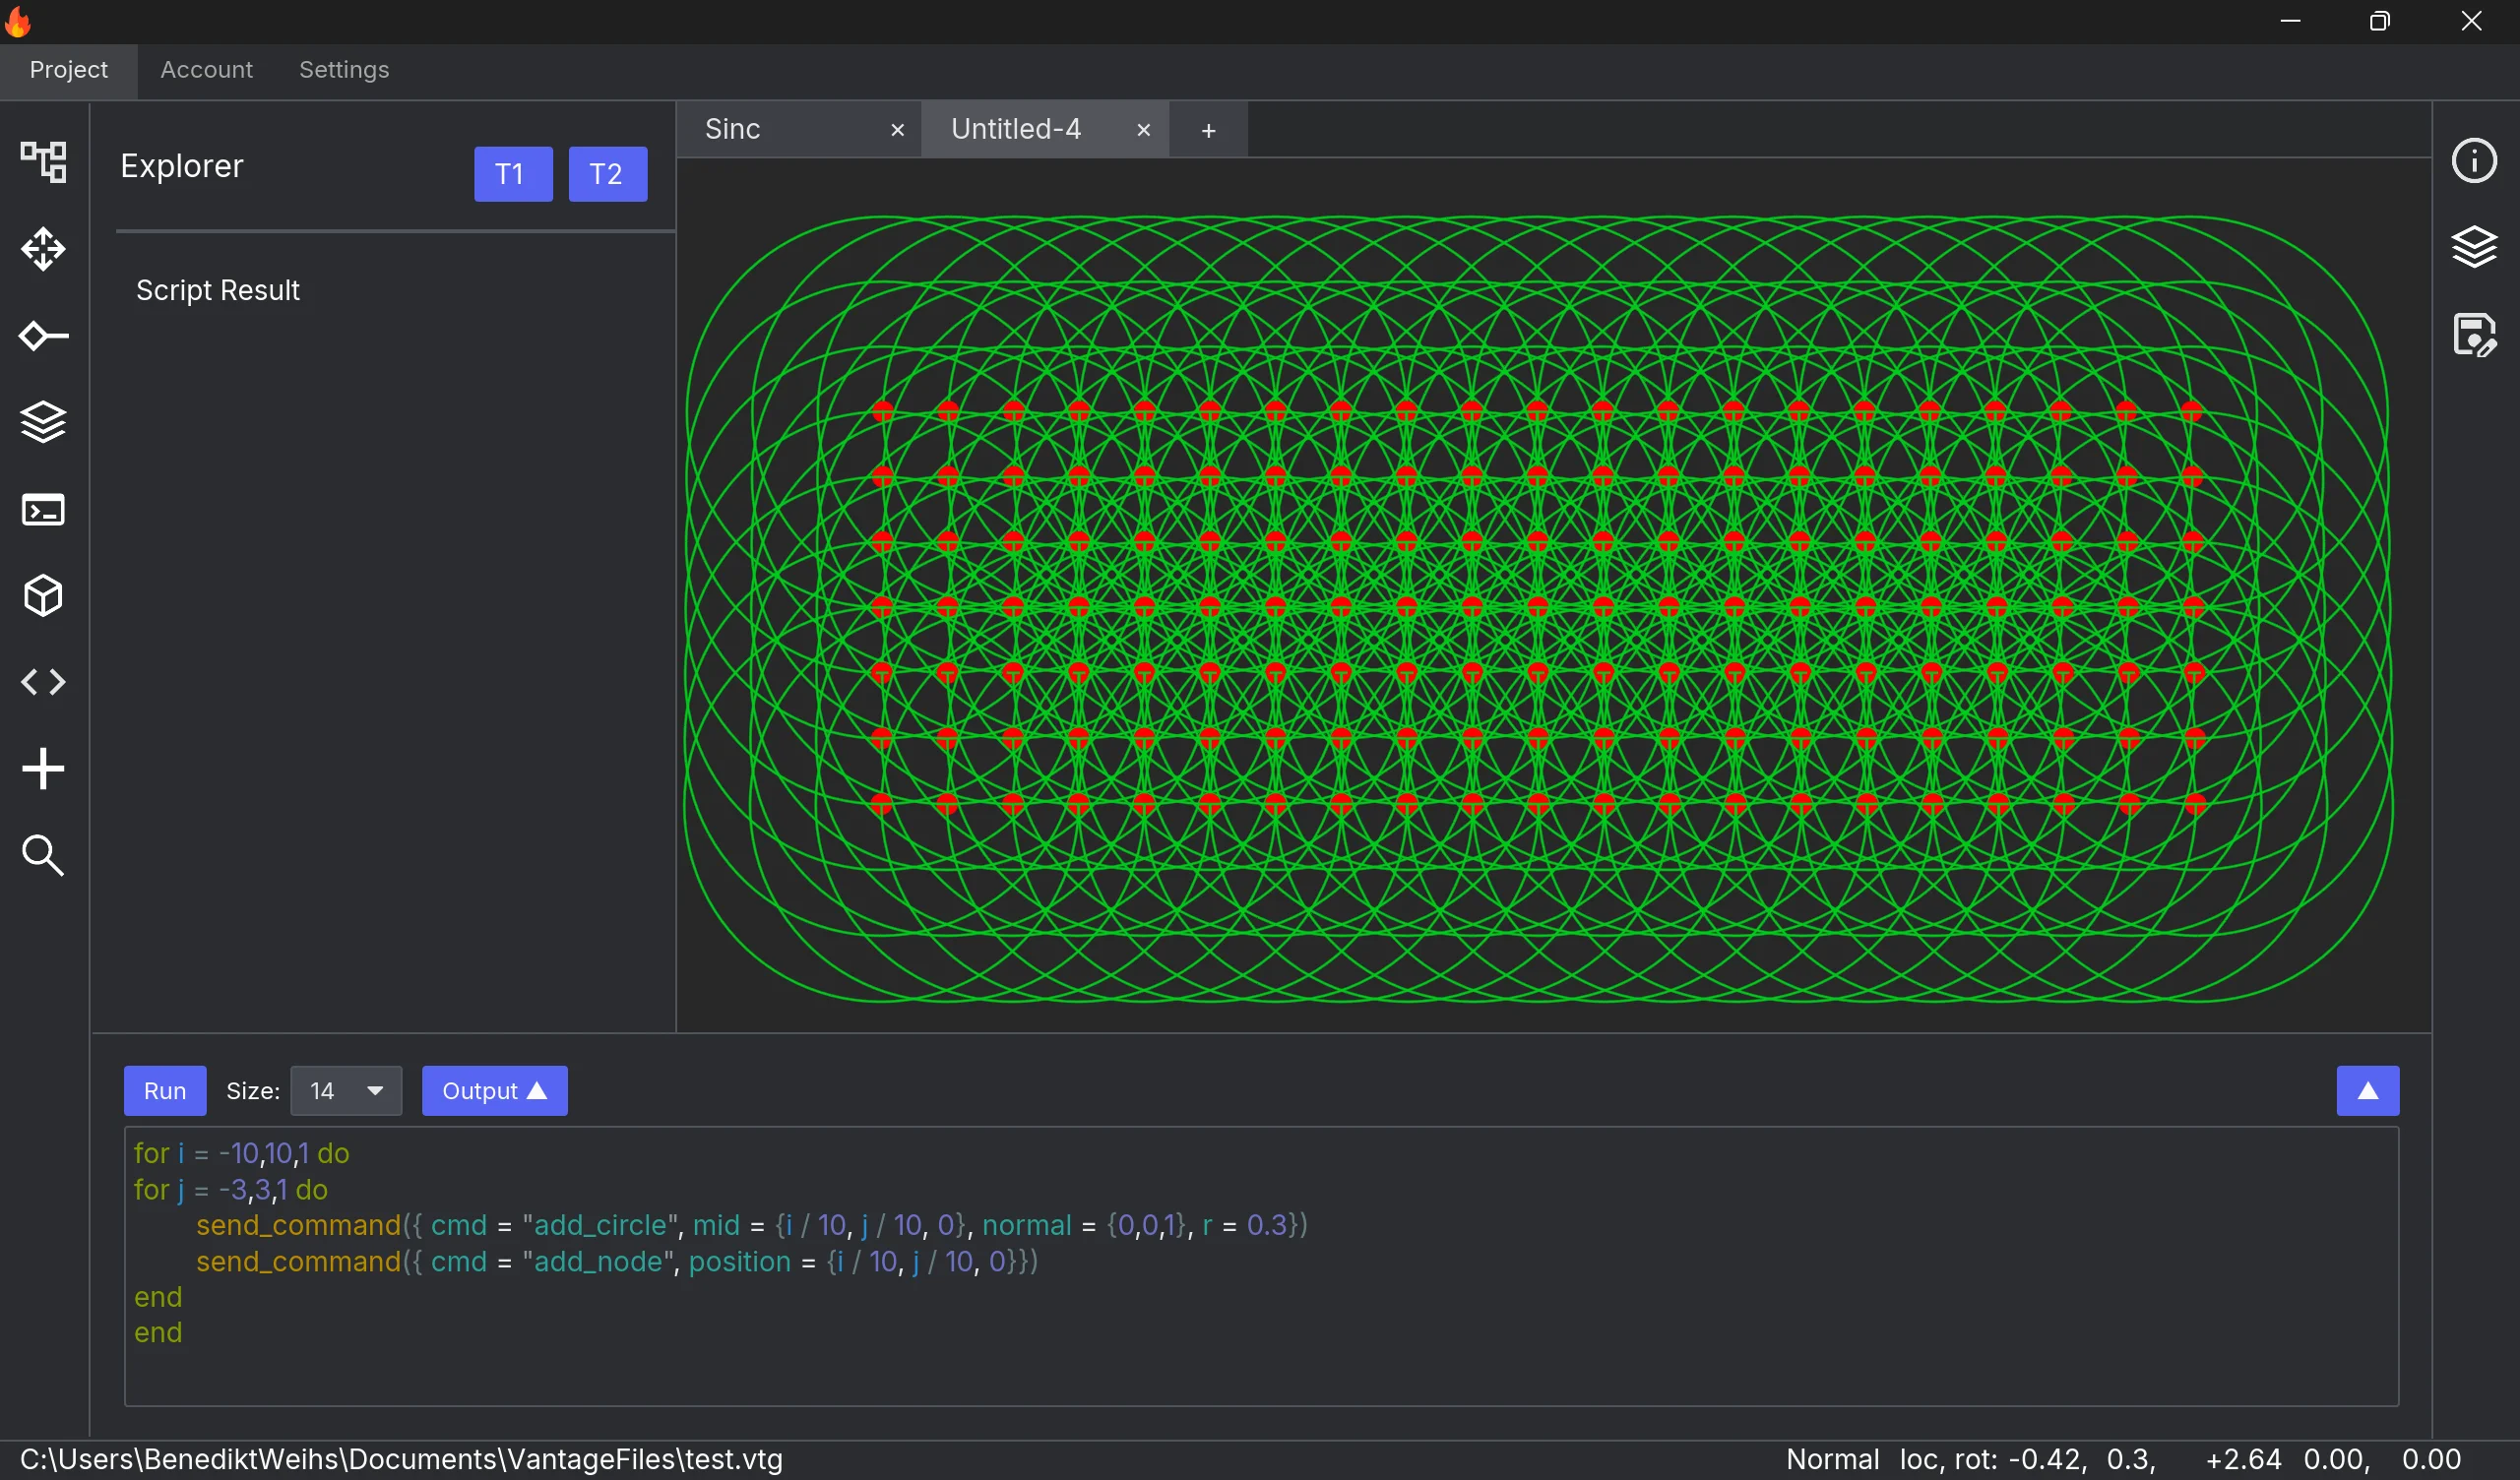
This scene shows the application layout that I built using the iced pane_grid module. Beyond panes that can be moved to the left, bottom, right or center there are also tabs. Each tab gets its own resource explorer that only shows a single renderable which is the result of the script on the bottom.
Except for the limitation that mlua does not yet compile to wasm32-unknown-unknown it looks the exact same in any browser supporting webgpu. I chose to include scripting support for JS using webworkers for now although I hope that mlua will support the required target soon.
There are quite a few more features that are already implemented:
- (rectangle) selection
- positioning (translation and rotation) settings
- line thickness settings
- node size settings
- rendering shells from x,y,z csv files
- global search for actions and keyboard based navigation
- per tab scenes with the ability to rename tabs
- json api using a tcp socket
- alacritty terminal included in its own pane
Goal
I want this application to be a general purpose data visualization engine. I dont think that I will be able to compete with applications such as blender on the rendering quality of a given scene. However, I do think that a *simple* way to create even complex technical visualizations is currently needed but not available for a lot of engineers. I first got this impression when working as an optical engineer building a bow-tie cavity while simulating geometrical optical configurations. Simulating 10^9 possible optical configurations is not that hard. But producing an image that shows how a given one looks like is typically quite involved. I felt the same when simulating quadrupole mass spectrometers in a uni course.
There are countless other fields that require highly non-standard ways of displaying data. While there are a lot of tools that are able to create these, i don’t know a single one that allows the user to do it easily. To this end it will be important that vantage is able to produce all kinds of output (svg, pdf, gif, mp4, step, …).
Leave a Reply